Plot with multiple lines and a log axis

Plot with multiple lines and a log axis#

This example demonstrates:

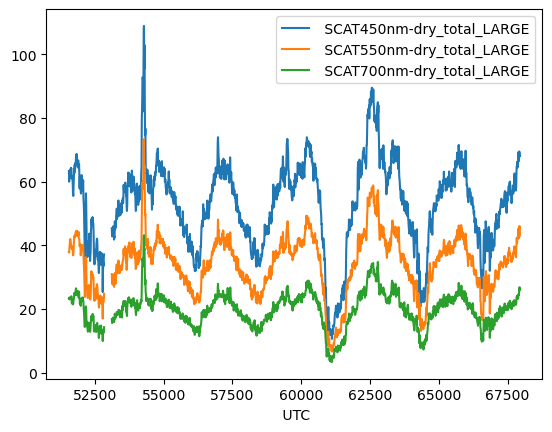
  • plotting multiple columns from a pandas dataframe into a line plot

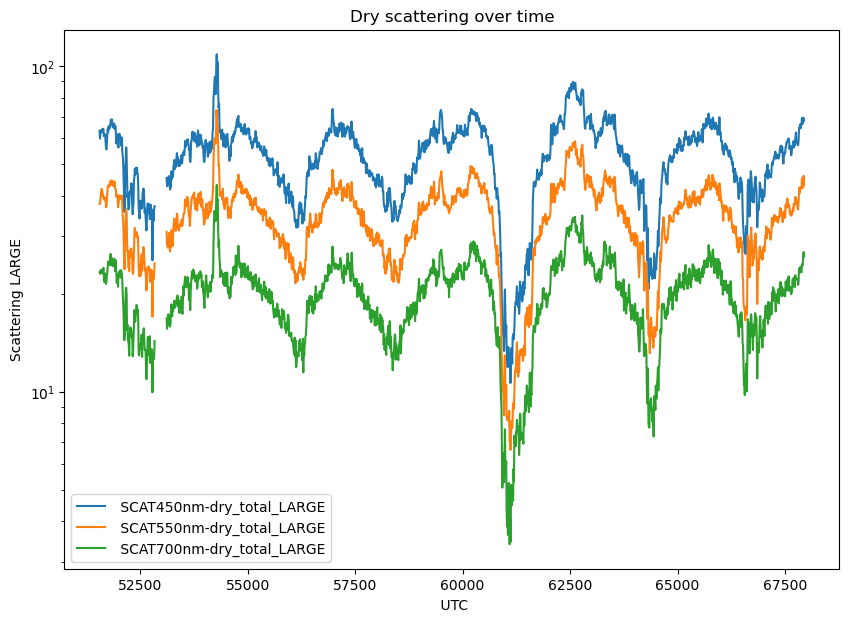
  • using a log axis

import matplotlib.pyplot as plt
import pandas as pd
import numpy as np
pd.set_option('display.max_columns', 8)

Data opening and discovery#

discoveraq_all = pd.read_csv('../lessons/tabular_data/data/discoveraq-mrg10-p3b_merge_20140720_R2.ict', skiprows=182)
---------------------------------------------------------------------------
FileNotFoundError                         Traceback (most recent call last)
Cell In[3], line 1
----> 1 discoveraq_all = pd.read_csv('../lessons/tabular_data/data/discoveraq-mrg10-p3b_merge_20140720_R2.ict', skiprows=182)

File ~/miniconda3/envs/sarp_docs2/lib/python3.12/site-packages/pandas/io/parsers/readers.py:1026, in read_csv(filepath_or_buffer, sep, delimiter, header, names, index_col, usecols, dtype, engine, converters, true_values, false_values, skipinitialspace, skiprows, skipfooter, nrows, na_values, keep_default_na, na_filter, verbose, skip_blank_lines, parse_dates, infer_datetime_format, keep_date_col, date_parser, date_format, dayfirst, cache_dates, iterator, chunksize, compression, thousands, decimal, lineterminator, quotechar, quoting, doublequote, escapechar, comment, encoding, encoding_errors, dialect, on_bad_lines, delim_whitespace, low_memory, memory_map, float_precision, storage_options, dtype_backend)
   1013 kwds_defaults = _refine_defaults_read(
   1014     dialect,
   1015     delimiter,
   (...)
   1022     dtype_backend=dtype_backend,
   1023 )
   1024 kwds.update(kwds_defaults)
-> 1026 return _read(filepath_or_buffer, kwds)

File ~/miniconda3/envs/sarp_docs2/lib/python3.12/site-packages/pandas/io/parsers/readers.py:620, in _read(filepath_or_buffer, kwds)
    617 _validate_names(kwds.get("names", None))
    619 # Create the parser.
--> 620 parser = TextFileReader(filepath_or_buffer, **kwds)
    622 if chunksize or iterator:
    623     return parser

File ~/miniconda3/envs/sarp_docs2/lib/python3.12/site-packages/pandas/io/parsers/readers.py:1620, in TextFileReader.__init__(self, f, engine, **kwds)
   1617     self.options["has_index_names"] = kwds["has_index_names"]
   1619 self.handles: IOHandles | None = None
-> 1620 self._engine = self._make_engine(f, self.engine)

File ~/miniconda3/envs/sarp_docs2/lib/python3.12/site-packages/pandas/io/parsers/readers.py:1880, in TextFileReader._make_engine(self, f, engine)
   1878     if "b" not in mode:
   1879         mode += "b"
-> 1880 self.handles = get_handle(
   1881     f,
   1882     mode,
   1883     encoding=self.options.get("encoding", None),
   1884     compression=self.options.get("compression", None),
   1885     memory_map=self.options.get("memory_map", False),
   1886     is_text=is_text,
   1887     errors=self.options.get("encoding_errors", "strict"),
   1888     storage_options=self.options.get("storage_options", None),
   1889 )
   1890 assert self.handles is not None
   1891 f = self.handles.handle

File ~/miniconda3/envs/sarp_docs2/lib/python3.12/site-packages/pandas/io/common.py:873, in get_handle(path_or_buf, mode, encoding, compression, memory_map, is_text, errors, storage_options)
    868 elif isinstance(handle, str):
    869     # Check whether the filename is to be opened in binary mode.
    870     # Binary mode does not support 'encoding' and 'newline'.
    871     if ioargs.encoding and "b" not in ioargs.mode:
    872         # Encoding
--> 873         handle = open(
    874             handle,
    875             ioargs.mode,
    876             encoding=ioargs.encoding,
    877             errors=errors,
    878             newline="",
    879         )
    880     else:
    881         # Binary mode
    882         handle = open(handle, ioargs.mode)

FileNotFoundError: [Errno 2] No such file or directory: '../lessons/tabular_data/data/discoveraq-mrg10-p3b_merge_20140720_R2.ict'
discoveraq_all
UTC JDAY INDEX FLIGHT ... C8-alkylbenzenes_MixingRatio C9-alkylbenzenes_MixingRatio Monoterpenes_MixingRatio BC_mass
0 50955 201 20001 2 ... -9999999.0 -9999999.0 -9999999.0 -9999999
1 50965 201 20002 2 ... -9999999.0 -9999999.0 -9999999.0 -9999999
2 50975 201 20003 2 ... -9999999.0 -9999999.0 -9999999.0 -9999999
3 50985 201 20004 2 ... -9999999.0 -9999999.0 -9999999.0 -9999999
4 50995 201 20005 2 ... -9999999.0 -9999999.0 -9999999.0 -9999999
... ... ... ... ... ... ... ... ... ...
1724 68195 201 21725 2 ... -9999999.0 -9999999.0 -9999999.0 -9999999
1725 68205 201 21726 2 ... -9999999.0 -9999999.0 -9999999.0 -9999999
1726 68215 201 21727 2 ... -9999999.0 -9999999.0 -9999999.0 -9999999
1727 68225 201 21728 2 ... -9999999.0 -9999999.0 -9999999.0 -9999999
1728 68235 201 21729 2 ... -9999999.0 -9999999.0 -9999999.0 -9999999

1729 rows × 138 columns

Data subsetting and cleaning#

discover_scat = discoveraq_all[[' UTC', ' SCAT450nm-dry_total_LARGE', 
                            ' SCAT550nm-dry_total_LARGE', ' SCAT700nm-dry_total_LARGE']]
# Clean nodata value
discover_scat = discover_scat.replace(-9999999, np.nan)
# Set UTC as an index so that pandas knows it should be the x axis
discover_scat = discover_scat.set_index(' UTC')

Plotting#

# plot using the built in pandas function
discover_scat.plot()
<Axes: xlabel=' UTC'>
../../_images/27d2dc872c64978c42eaaaa4b2e841f94d3e4f410f0d25ab19fa93628d43178b.png
fig, ax = plt.subplots()
fig.set_size_inches(10, 7)

# plot the same pandas plot on a matplotlib specified axis
discover_scat.plot(ax=ax)

# Set the y axis to be a log scale
ax.set_yscale('log')

# Add labels
ax.set_title('Dry scattering over time')
ax.set_ylabel('Scattering LARGE')
Text(0, 0.5, 'Scattering LARGE')
../../_images/546938804831a98709571a16417f35f0cc92e6f03b951fa4879480cc5e77c7ea.png