Flight Track Plot#
This example notebook demonstrates:
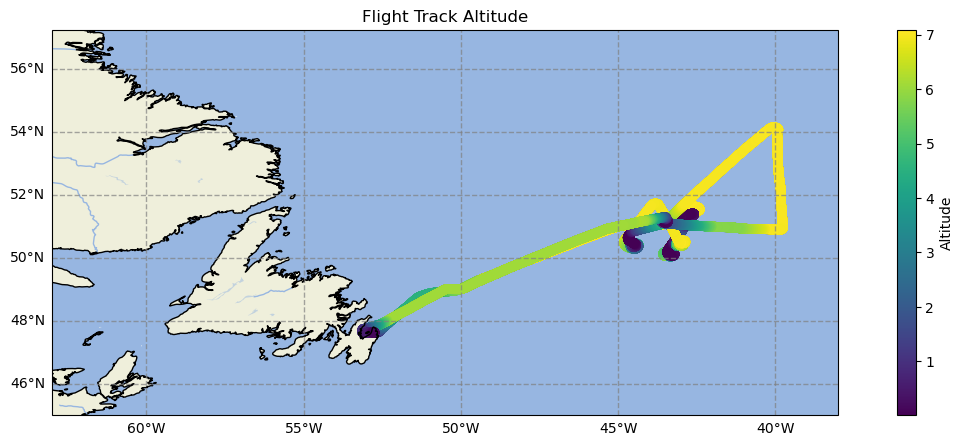
using cartopy to plot data on a map
using the cfeatures module of cartopy to add land/ocean features
adding a colorbar
import pandas as pd
import geopandas as gpd
import numpy as np
import matplotlib.pyplot as plt
import cartopy.crs as ccrs
import cartopy.feature as cfeature
# Read dataset
naames = pd.read_csv('../lessons/tabular_data/data/naames-mrg01-c130_merge_20151112_R5_thru20151114.csv', skiprows=223)
# Filter down to just 1 day
naames = naames[naames[' Fractional_Day'] < 317]
# Remove NaN values
naames = naames.replace({-999999: np.nan})
# Create geodataframe
naames_gpd = gpd.GeoDataFrame(naames,
geometry=gpd.points_from_xy(naames[' LONGITUDE'], naames[' LATITUDE']),
crs='epsg:4326')
---------------------------------------------------------------------------
FileNotFoundError Traceback (most recent call last)
Cell In[2], line 2
1 # Read dataset
----> 2 naames = pd.read_csv('../lessons/tabular_data/data/naames-mrg01-c130_merge_20151112_R5_thru20151114.csv', skiprows=223)
3 # Filter down to just 1 day
4 naames = naames[naames[' Fractional_Day'] < 317]
File ~/miniconda3/envs/sarp_docs2/lib/python3.12/site-packages/pandas/io/parsers/readers.py:1026, in read_csv(filepath_or_buffer, sep, delimiter, header, names, index_col, usecols, dtype, engine, converters, true_values, false_values, skipinitialspace, skiprows, skipfooter, nrows, na_values, keep_default_na, na_filter, verbose, skip_blank_lines, parse_dates, infer_datetime_format, keep_date_col, date_parser, date_format, dayfirst, cache_dates, iterator, chunksize, compression, thousands, decimal, lineterminator, quotechar, quoting, doublequote, escapechar, comment, encoding, encoding_errors, dialect, on_bad_lines, delim_whitespace, low_memory, memory_map, float_precision, storage_options, dtype_backend)
1013 kwds_defaults = _refine_defaults_read(
1014 dialect,
1015 delimiter,
(...)
1022 dtype_backend=dtype_backend,
1023 )
1024 kwds.update(kwds_defaults)
-> 1026 return _read(filepath_or_buffer, kwds)
File ~/miniconda3/envs/sarp_docs2/lib/python3.12/site-packages/pandas/io/parsers/readers.py:620, in _read(filepath_or_buffer, kwds)
617 _validate_names(kwds.get("names", None))
619 # Create the parser.
--> 620 parser = TextFileReader(filepath_or_buffer, **kwds)
622 if chunksize or iterator:
623 return parser
File ~/miniconda3/envs/sarp_docs2/lib/python3.12/site-packages/pandas/io/parsers/readers.py:1620, in TextFileReader.__init__(self, f, engine, **kwds)
1617 self.options["has_index_names"] = kwds["has_index_names"]
1619 self.handles: IOHandles | None = None
-> 1620 self._engine = self._make_engine(f, self.engine)
File ~/miniconda3/envs/sarp_docs2/lib/python3.12/site-packages/pandas/io/parsers/readers.py:1880, in TextFileReader._make_engine(self, f, engine)
1878 if "b" not in mode:
1879 mode += "b"
-> 1880 self.handles = get_handle(
1881 f,
1882 mode,
1883 encoding=self.options.get("encoding", None),
1884 compression=self.options.get("compression", None),
1885 memory_map=self.options.get("memory_map", False),
1886 is_text=is_text,
1887 errors=self.options.get("encoding_errors", "strict"),
1888 storage_options=self.options.get("storage_options", None),
1889 )
1890 assert self.handles is not None
1891 f = self.handles.handle
File ~/miniconda3/envs/sarp_docs2/lib/python3.12/site-packages/pandas/io/common.py:873, in get_handle(path_or_buf, mode, encoding, compression, memory_map, is_text, errors, storage_options)
868 elif isinstance(handle, str):
869 # Check whether the filename is to be opened in binary mode.
870 # Binary mode does not support 'encoding' and 'newline'.
871 if ioargs.encoding and "b" not in ioargs.mode:
872 # Encoding
--> 873 handle = open(
874 handle,
875 ioargs.mode,
876 encoding=ioargs.encoding,
877 errors=errors,
878 newline="",
879 )
880 else:
881 # Binary mode
882 handle = open(handle, ioargs.mode)
FileNotFoundError: [Errno 2] No such file or directory: '../lessons/tabular_data/data/naames-mrg01-c130_merge_20151112_R5_thru20151114.csv'
from mpl_toolkits.axes_grid1 import make_axes_locatable
from matplotlib.ticker import StrMethodFormatter
# Define the plot CRS
crs = ccrs.PlateCarree()
# Convert the dataframe to that crs
naames_gpd_pc = naames_gpd.to_crs(crs.proj4_init)
# Create the figure
fig = plt.figure()
ax = plt.axes(projection=crs)
fig.set_size_inches(15, 5) # Increase the size of the plot
# Add background features
ax.add_feature(cfeature.LAND)
ax.add_feature(cfeature.OCEAN)
ax.add_feature(cfeature.COASTLINE)
ax.add_feature(cfeature.BORDERS, linestyle=':')
ax.add_feature(cfeature.LAKES, alpha=0.5)
ax.add_feature(cfeature.RIVERS)
ax.set_title('Flight Track Altitude') # Add a title
# Add and format gridlines. Remove top and right labels
gl = ax.gridlines(crs=ccrs.PlateCarree(), draw_labels=True,
linewidth=1, color='gray', alpha=0.7, linestyle='--')
gl.top_labels, gl.right_labels = False, False
ax.set_extent([-63, -38, 45, 57]) # Broaden extent of plot
scatter = naames_gpd_pc.plot(ax=ax, column=' ALTP', legend=True, legend_kwds={'label': "Altitude"})
/Users/rwegener/miniconda3/envs/sarp/lib/python3.10/site-packages/cartopy/io/__init__.py:241: DownloadWarning: Downloading: https://naturalearth.s3.amazonaws.com/10m_physical/ne_10m_ocean.zip
warnings.warn(f'Downloading: {url}', DownloadWarning)
/Users/rwegener/miniconda3/envs/sarp/lib/python3.10/site-packages/cartopy/io/__init__.py:241: DownloadWarning: Downloading: https://naturalearth.s3.amazonaws.com/10m_physical/ne_10m_lakes.zip
warnings.warn(f'Downloading: {url}', DownloadWarning)