Mapping with cartopy and Colors#
Context#
Yesterday we explored the exciting world of combining geospatial information with our pandas dataframe in the context of analysis and computations. Today we are going to now see what we can do with visualization when we have geospatial information. We are going to use the library cartopy to make maps and we will also explore some more visualization features of matplotlib.
Today are going to use a geodataframe of the NAAMES dataset.
import pandas as pd
import geopandas as gpd
import numpy as np
naames = pd.read_csv('./data/naames-mrg01-c130_merge_20151112_R5_thru20151114.csv', skiprows=223)
# Filter down to just 1 day
naames = naames[naames[' Fractional_Day'] < 317]
# Remove NaN values
naames = naames.replace({-999999: np.nan})
# Create geodataframe
naames_gpd = gpd.GeoDataFrame(naames,
                            geometry=gpd.points_from_xy(naames[' LONGITUDE'], naames[' LATITUDE']),
                            crs='epsg:4326')
cartopy#
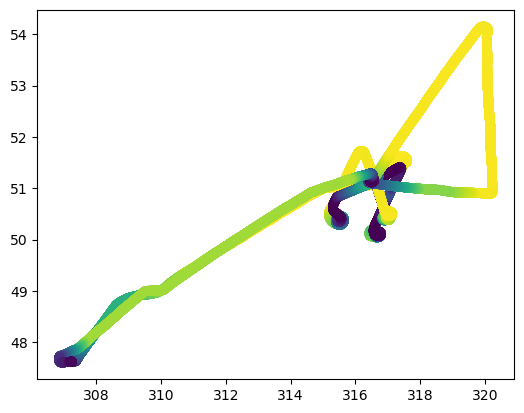
Yesterday we saw that for a quick visual we could use the .plot() function to look at our data on a latitude/longitude axis. This is nice and it is easy, but we lack context in this simplified view.
naames_gpd.plot(column=' ALTP')
<Axes: >
To expand our map we are going to use cartopy. Some advantages of cartopy are:
ability to reproject a dataset
ability to plot data from different projections together
ability to add features such as coastlines below your data, similar to a basemap
Let’s see an example of using cartopy by re-creating the map above with some features below.
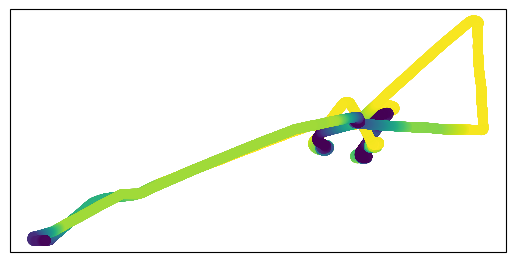
cartopy builds into the matplotlib OOP interface, so let’s start by creating a map with matplotlib OOP.
import matplotlib.pyplot as plt
fig = plt.figure()
ax = plt.axes()

naames_gpd.plot(ax=ax, column=' ALTP')
<Axes: >
Now the plot above doesn’t use cartopy, it’s just the same map as the geopandas version but plotted in a different way. To change to using cartopy we have to:
define our crs
convert our geopandas dataframe to that crs
add the crs as an argument to
plt.axes()
The CRS we are going to use is called PlateCarree.
import cartopy.crs as ccrs
# Create the projection
crs = ccrs.PlateCarree()

# This can be converted into a `proj4` string/dict compatible with GeoPandas
naames_platecarree = naames_gpd.to_crs(crs.proj4_init)
# Recreate the plot with the projection as an argument
fig = plt.figure()
ax = plt.axes(projection=crs)

naames_platecarree.plot(ax=ax, column=' ALTP')
<GeoAxes: >
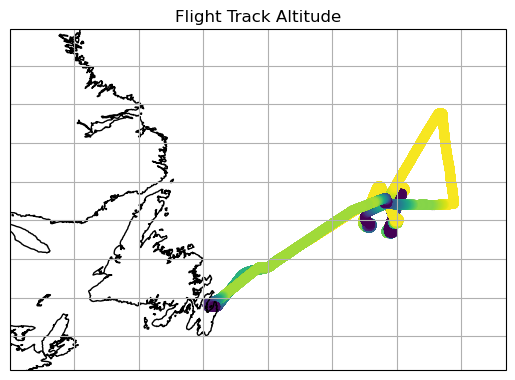
So far it looks like we’ve taken a step backwards because we have lost our nice axis labels. We can add those back, however, using the .gridlines() method. Additionally, we can use the .coastlines() feature to add in the shape of the nearby continent. I’m also going to use .set_extent() to give us a bit broader view and a title for clarity.
# Recreate the plot with the projection as an argument
fig = plt.figure()
ax = plt.axes(projection=crs)

# Add the data
naames_platecarree.plot(ax=ax, column=' ALTP')

# Change the field of view
ax.set_extent([-63, -38, 45, 57])
# Add labels and gridlines
ax.gridlines(crs=crs, draw_labels=True)
# Add the shape of the coast
ax.coastlines()

# Add a title
ax.set_title('Flight Track Altitude')
Text(0.5, 1.0, 'Flight Track Altitude')
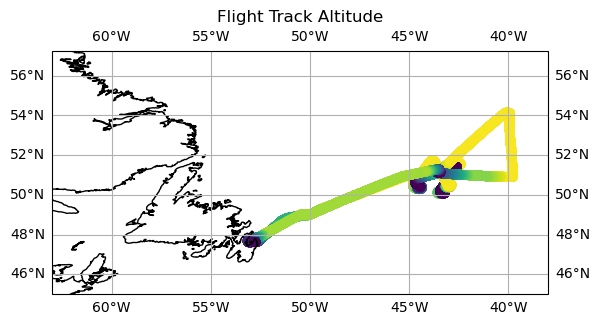
Looks nice! So with a bit of extra work we have converted out quick geopandas plot into a map with nice labels, gridlines and coastlines.
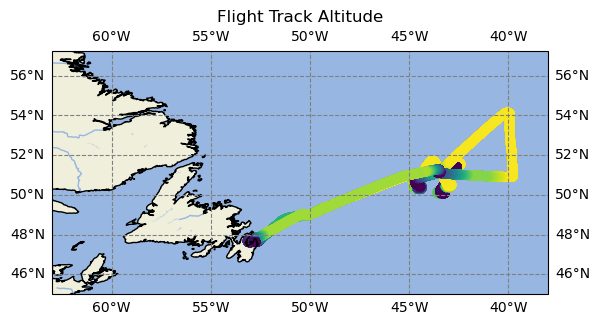
cartopy Features#
One of the nice built-in features of cartopy is that it can download and render features layers such as coastlines, rivers, and some political boundaries on your map. The example below shows how to use features with the pre-built cartopy features. This example also shows how to create a custom feature.
import cartopy.feature as cfeature
# Recreate the plot with the projection as an argument
fig = plt.figure()
ax = plt.axes(projection=crs)

# Add the data
naames_platecarree.plot(ax=ax, column=' ALTP')

# Change the field of view
ax.set_extent([-63, -38, 45, 57])
# Add labels and gridlines
ax.gridlines(crs=crs, color='grey', linestyle='--', draw_labels=True)

# Add background features
ax.add_feature(cfeature.LAND)
ax.add_feature(cfeature.OCEAN)
ax.add_feature(cfeature.COASTLINE)
ax.add_feature(cfeature.BORDERS, linestyle=':')
ax.add_feature(cfeature.LAKES, alpha=0.5)
ax.add_feature(cfeature.RIVERS)

# Add a title
ax.set_title('Flight Track Altitude')
Text(0.5, 1.0, 'Flight Track Altitude')
Transforming Data#
One of the nice parts of cartopy is that it lets you change your projection farily easily. To do this we will define a different starting projection, then run the same code again.
# Create the projection
crs = ccrs.AlbersEqualArea(-50, 52)

# This can be converted into a `proj4` string/dict compatible with GeoPandas
naames_albers = naames_gpd.to_crs(crs.proj4_init)
# Recreate the plot with the projection as an argument
fig = plt.figure()
ax = plt.axes(projection=crs)

# Add the data
naames_albers.plot(ax=ax, column=' ALTP')

# Change the field of view
ax.set_extent([-63, -38, 45, 57])
# Add labels and gridlines
ax.gridlines(crs=crs)
# Add the shape of the coast
ax.coastlines()

# Add a title
ax.set_title('Flight Track Altitude')
Text(0.5, 1.0, 'Flight Track Altitude')
There are lots of projections and which one you want depends on where in the world you are. A full list of projections can be found here.
For flight track data the change in projection likely won’t matter very much. Where this feature becomes useful is if you are plotting two data sources with different starting projections. If that is the case then we can use these features to convert the different sources to the same projection.
Color in matplotlib#
There are a variety of ways to deal with color and colorbars in matplotlib.
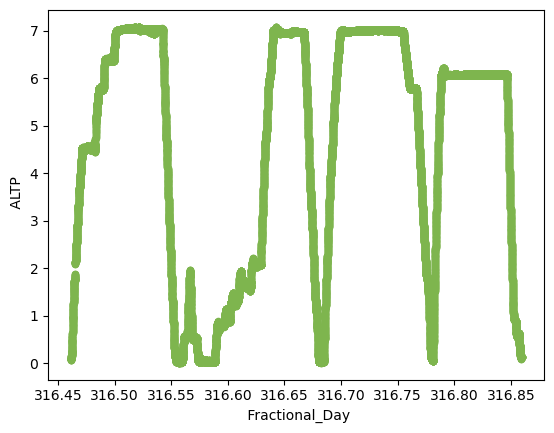
Firstly, color can be specified in several ways. When specifying a single color you can use RGB, hexadecimal, or sometimes by a written name. A full list of the options is in the docs. Another useful tool is an online color picker. There are dozens of these available so try a couple to find your favorite. One I have used before is the W3Schools Color Picker.
naames.plot.scatter(x=' Fractional_Day', y=' ALTP', c='#7eb54e')  # hexadecimal color code
# naames.plot.scatter(x=' Fractional_Day', y=' ALTP', c=(0.49, 0.75, 0.97))  # RGB color code
<Axes: xlabel=' Fractional_Day', ylabel=' ALTP'>
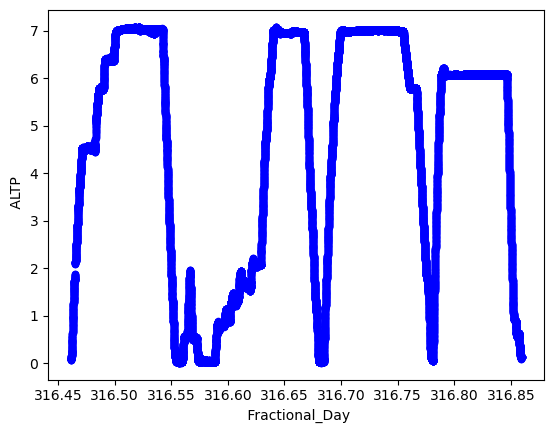
naames.plot.scatter(x=' Fractional_Day', y=' ALTP', c='blue')
<Axes: xlabel=' Fractional_Day', ylabel=' ALTP'>
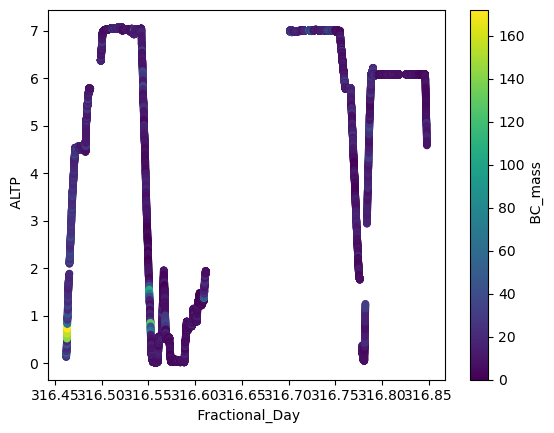
We have also seen that you can use another column to create the color for a scatter plot.
naames.plot.scatter(x=' Fractional_Day', y=' ALTP', c=' BC_mass')
<Axes: xlabel=' Fractional_Day', ylabel=' ALTP'>
Adding a color-based legend to a plot is called adding a colorbar. When adding a colorbar there are multiple components:
The values that are used to determine the color at that point
The colors that are going to be used for the range of values These two things are two seperate inputs,
cfor the first one, andcmapfor the second one.
# _r on the colormap reverses. So viridis and viridis_r both work
naames.plot.scatter(x=' Fractional_Day', y=' ALTP', c=' BC_mass', colormap='viridis')
<Axes: xlabel=' Fractional_Day', ylabel=' ALTP'>
A list of the available colormaps can be found here.
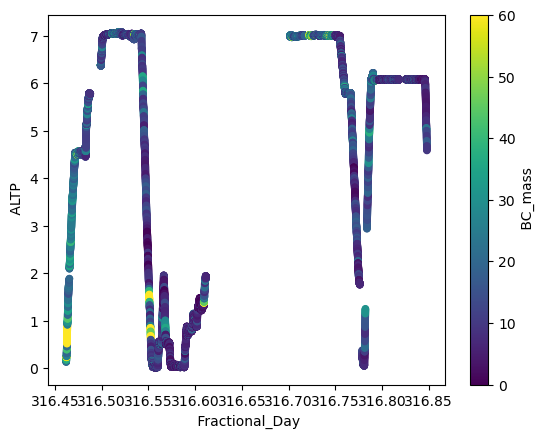
A common parameter you may want to access are vmax and vmin. These don’t change the values in your dataset, but they do change the which values correspond to which colors in your colormap.
naames.plot.scatter(x=' Fractional_Day', y=' ALTP', c=' BC_mass', colormap='viridis', vmax=60)
<Axes: xlabel=' Fractional_Day', ylabel=' ALTP'>
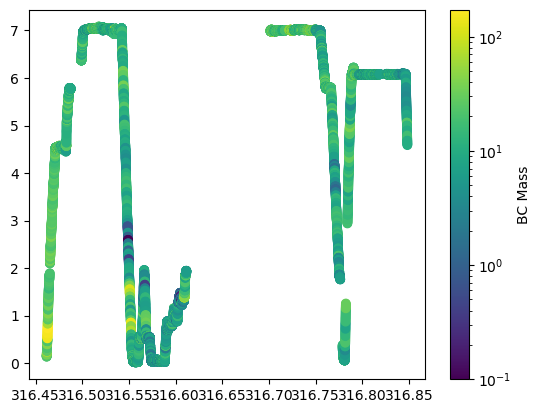
It is possible to have your colorbar have a log colormap, you just have to switch into matplotlib.
import matplotlib.colors
plt.scatter(naames[' Fractional_Day'], naames[' ALTP'], c=naames[' BC_mass'],
                    cmap='viridis', norm=matplotlib.colors.LogNorm())

plt.colorbar(label='BC Mass')
<matplotlib.colorbar.Colorbar at 0x7f68d2533810>
Code Summary#
Preprocessing#
import pandas as pd
import geopandas as gpd
import numpy as np
import matplotlib.pyplot as plt
naames = pd.read_csv('./data/naames-mrg01-c130_merge_20151112_R5_thru20151114.csv', skiprows=223)
# Filter down to just 1 day
naames = naames[naames[' Fractional_Day'] < 317]
# Remove NaN values
naames = naames.replace({-999999: np.nan})
# Create geodataframe
naames_gpd = gpd.GeoDataFrame(naames,
                            geometry=gpd.points_from_xy(naames[' LONGITUDE'], naames[' LATITUDE']),
                            crs='epsg:4326')
Mapping#
Using geopandas#
fig = plt.figure()
ax = plt.axes()

naames_gpd.plot(ax=ax, column=' ALTP')
<Axes: >
Using cartopy#
# Recreate the plot with the projection as an argument
fig = plt.figure()
ax = plt.axes(projection=crs)

# Add the data
naames_platecarree.plot(ax=ax, column=' ALTP')

# Change the field of view
ax.set_extent([-63, -38, 45, 57])
# Add labels and gridlines
# ax.gridlines(crs=crs, color='grey', linestyle='--', draw_labels=True)

# Add background features
ax.add_feature(cfeature.LAND)
ax.add_feature(cfeature.OCEAN)
ax.add_feature(cfeature.COASTLINE)
ax.add_feature(cfeature.BORDERS, linestyle=':')
ax.add_feature(cfeature.LAKES, alpha=0.5)
ax.add_feature(cfeature.RIVERS)

# Add a title
ax.set_title('Flight Track Altitude')
Text(0.5, 1.0, 'Flight Track Altitude')
Error in callback <function _draw_all_if_interactive at 0x7f68e6861260> (for post_execute), with arguments args (),kwargs {}:
---------------------------------------------------------------------------
KeyboardInterrupt                         Traceback (most recent call last)
File /srv/conda/envs/notebook/lib/python3.11/site-packages/matplotlib/pyplot.py:197, in _draw_all_if_interactive()
    195 def _draw_all_if_interactive() -> None:
    196     if matplotlib.is_interactive():
--> 197         draw_all()

File /srv/conda/envs/notebook/lib/python3.11/site-packages/matplotlib/_pylab_helpers.py:132, in Gcf.draw_all(cls, force)
    130 for manager in cls.get_all_fig_managers():
    131     if force or manager.canvas.figure.stale:
--> 132         manager.canvas.draw_idle()

File /srv/conda/envs/notebook/lib/python3.11/site-packages/matplotlib/backend_bases.py:1893, in FigureCanvasBase.draw_idle(self, *args, **kwargs)
   1891 if not self._is_idle_drawing:
   1892     with self._idle_draw_cntx():
-> 1893         self.draw(*args, **kwargs)

File /srv/conda/envs/notebook/lib/python3.11/site-packages/matplotlib/backends/backend_agg.py:388, in FigureCanvasAgg.draw(self)
    385 # Acquire a lock on the shared font cache.
    386 with (self.toolbar._wait_cursor_for_draw_cm() if self.toolbar
    387       else nullcontext()):
--> 388     self.figure.draw(self.renderer)
    389     # A GUI class may be need to update a window using this draw, so
    390     # don't forget to call the superclass.
    391     super().draw()

File /srv/conda/envs/notebook/lib/python3.11/site-packages/matplotlib/artist.py:95, in _finalize_rasterization.<locals>.draw_wrapper(artist, renderer, *args, **kwargs)
     93 @wraps(draw)
     94 def draw_wrapper(artist, renderer, *args, **kwargs):
---> 95     result = draw(artist, renderer, *args, **kwargs)
     96     if renderer._rasterizing:
     97         renderer.stop_rasterizing()

File /srv/conda/envs/notebook/lib/python3.11/site-packages/matplotlib/artist.py:72, in allow_rasterization.<locals>.draw_wrapper(artist, renderer)
     69     if artist.get_agg_filter() is not None:
     70         renderer.start_filter()
---> 72     return draw(artist, renderer)
     73 finally:
     74     if artist.get_agg_filter() is not None:

File /srv/conda/envs/notebook/lib/python3.11/site-packages/matplotlib/figure.py:3154, in Figure.draw(self, renderer)
   3151         # ValueError can occur when resizing a window.
   3153 self.patch.draw(renderer)
-> 3154 mimage._draw_list_compositing_images(
   3155     renderer, self, artists, self.suppressComposite)
   3157 for sfig in self.subfigs:
   3158     sfig.draw(renderer)

File /srv/conda/envs/notebook/lib/python3.11/site-packages/matplotlib/image.py:132, in _draw_list_compositing_images(renderer, parent, artists, suppress_composite)
    130 if not_composite or not has_images:
    131     for a in artists:
--> 132         a.draw(renderer)
    133 else:
    134     # Composite any adjacent images together
    135     image_group = []

File /srv/conda/envs/notebook/lib/python3.11/site-packages/matplotlib/artist.py:72, in allow_rasterization.<locals>.draw_wrapper(artist, renderer)
     69     if artist.get_agg_filter() is not None:
     70         renderer.start_filter()
---> 72     return draw(artist, renderer)
     73 finally:
     74     if artist.get_agg_filter() is not None:

File /srv/conda/envs/notebook/lib/python3.11/site-packages/cartopy/mpl/geoaxes.py:535, in GeoAxes.draw(self, renderer, **kwargs)
    530         self.imshow(img, extent=extent, origin=origin,
    531                     transform=factory.crs, *factory_args[1:],
    532                     **factory_kwargs)
    533 self._done_img_factory = True
--> 535 return super().draw(renderer=renderer, **kwargs)

File /srv/conda/envs/notebook/lib/python3.11/site-packages/matplotlib/artist.py:72, in allow_rasterization.<locals>.draw_wrapper(artist, renderer)
     69     if artist.get_agg_filter() is not None:
     70         renderer.start_filter()
---> 72     return draw(artist, renderer)
     73 finally:
     74     if artist.get_agg_filter() is not None:

File /srv/conda/envs/notebook/lib/python3.11/site-packages/matplotlib/axes/_base.py:3070, in _AxesBase.draw(self, renderer)
   3067 if artists_rasterized:
   3068     _draw_rasterized(self.figure, artists_rasterized, renderer)
-> 3070 mimage._draw_list_compositing_images(
   3071     renderer, self, artists, self.figure.suppressComposite)
   3073 renderer.close_group('axes')
   3074 self.stale = False

File /srv/conda/envs/notebook/lib/python3.11/site-packages/matplotlib/image.py:132, in _draw_list_compositing_images(renderer, parent, artists, suppress_composite)
    130 if not_composite or not has_images:
    131     for a in artists:
--> 132         a.draw(renderer)
    133 else:
    134     # Composite any adjacent images together
    135     image_group = []

File /srv/conda/envs/notebook/lib/python3.11/site-packages/matplotlib/artist.py:72, in allow_rasterization.<locals>.draw_wrapper(artist, renderer)
     69     if artist.get_agg_filter() is not None:
     70         renderer.start_filter()
---> 72     return draw(artist, renderer)
     73 finally:
     74     if artist.get_agg_filter() is not None:

File /srv/conda/envs/notebook/lib/python3.11/site-packages/cartopy/mpl/feature_artist.py:186, in FeatureArtist.draw(self, renderer, *args, **kwargs)
    184 if geom_paths is None:
    185     if ax.projection != feature_crs:
--> 186         projected_geom = ax.projection.project_geometry(
    187             geom, feature_crs)
    188     else:
    189         projected_geom = geom

File /srv/conda/envs/notebook/lib/python3.11/site-packages/cartopy/crs.py:817, in Projection.project_geometry(self, geometry, src_crs)
    815 if not method_name:
    816     raise ValueError(f'Unsupported geometry type {geom_type!r}')
--> 817 return getattr(self, method_name)(geometry, src_crs)

File /srv/conda/envs/notebook/lib/python3.11/site-packages/cartopy/crs.py:933, in Projection._project_multipolygon(self, geometry, src_crs)
    931 geoms = []
    932 for geom in geometry.geoms:
--> 933     r = self._project_polygon(geom, src_crs)
    934     if r:
    935         geoms.extend(r.geoms)

File /srv/conda/envs/notebook/lib/python3.11/site-packages/cartopy/crs.py:960, in Projection._project_polygon(self, polygon, src_crs)
    958 multi_lines = []
    959 for src_ring in [polygon.exterior] + list(polygon.interiors):
--> 960     p_rings, p_mline = self._project_linear_ring(src_ring, src_crs)
    961     if p_rings:
    962         rings.extend(p_rings)

File /srv/conda/envs/notebook/lib/python3.11/site-packages/cartopy/crs.py:836, in Projection._project_linear_ring(self, linear_ring, src_crs)
    831 debug = False
    832 # 1) Resolve the initial lines into projected segments
    833 # 1abc
    834 # def23ghi
    835 # jkl41
--> 836 multi_line_string = cartopy.trace.project_linear(linear_ring,
    837                                                  src_crs, self)
    839 # Threshold for whether a point is close enough to be the same
    840 # point as another.
    841 threshold = max(np.abs(self.x_limits + self.y_limits)) * 1e-5

File lib/cartopy/trace.pyx:589, in cartopy.trace.project_linear()

File lib/cartopy/trace.pyx:483, in cartopy.trace._project_segment()

File lib/cartopy/trace.pyx:414, in cartopy.trace.bisect()

File lib/cartopy/trace.pyx:377, in cartopy.trace.straightAndDomain()

File /srv/conda/envs/notebook/lib/python3.11/site-packages/shapely/prepared.py:45, in PreparedGeometry.covers(self, other)
     43 def covers(self, other):
     44     """Returns True if the geometry covers the other, else False"""
---> 45     return self.context.covers(other)

File /srv/conda/envs/notebook/lib/python3.11/site-packages/shapely/geometry/base.py:667, in BaseGeometry.covers(self, other)
    665 def covers(self, other):
    666     """Returns True if the geometry covers the other, else False"""
--> 667     return _maybe_unpack(shapely.covers(self, other))

File /srv/conda/envs/notebook/lib/python3.11/site-packages/shapely/geometry/base.py:72, in _maybe_unpack(result)
     69 def _maybe_unpack(result):
     70     if result.ndim == 0:
     71         # convert numpy 0-d array / scalar to python scalar
---> 72         return result.item()
     73     else:
     74         # >=1 dim array
     75         return result

KeyboardInterrupt: